GroceryStore_Sales_Analysis
SALES OVERVIEW
Project overview
- This project explores sales data for an international grocery store chain.
- I explore the relationship between variables: sales, regions, customers, products, stores, returns and calender.
- We can obtain conclusions that will help us to make better marketing campaigns and improve profits.
Objectives:
Develop a sales report for 2019/2020 annual sales and returns. Summarize information about the business´s current situation to understand how to make more profits.
The most important indicators are sales, region, top customers, and top products:
Deliverables:
| Demanding | Value | Deliverable |
|---|---|---|
| A anaylsis on the different types of customer membership levels | Identifying the types of customers that contribute revunue and the products they buy | A dashboard that displays revenue streams, filtered by membership levels and other variables |
| A detailed overview of 2019 and 2020 sales | To clearly highlight comapny performance and indicate areas to improve | A dashboard that can filter displays KPIs for orders, profit and returns, which can also be analysed at a monthly level |
| A dashboard that summarizes crucial information for exectuives | To understand which products, regions and customers have the biggest impact on the company | A dashboard that displays crucial information and shows key metrics and that can be updated everyday |
Data preparation

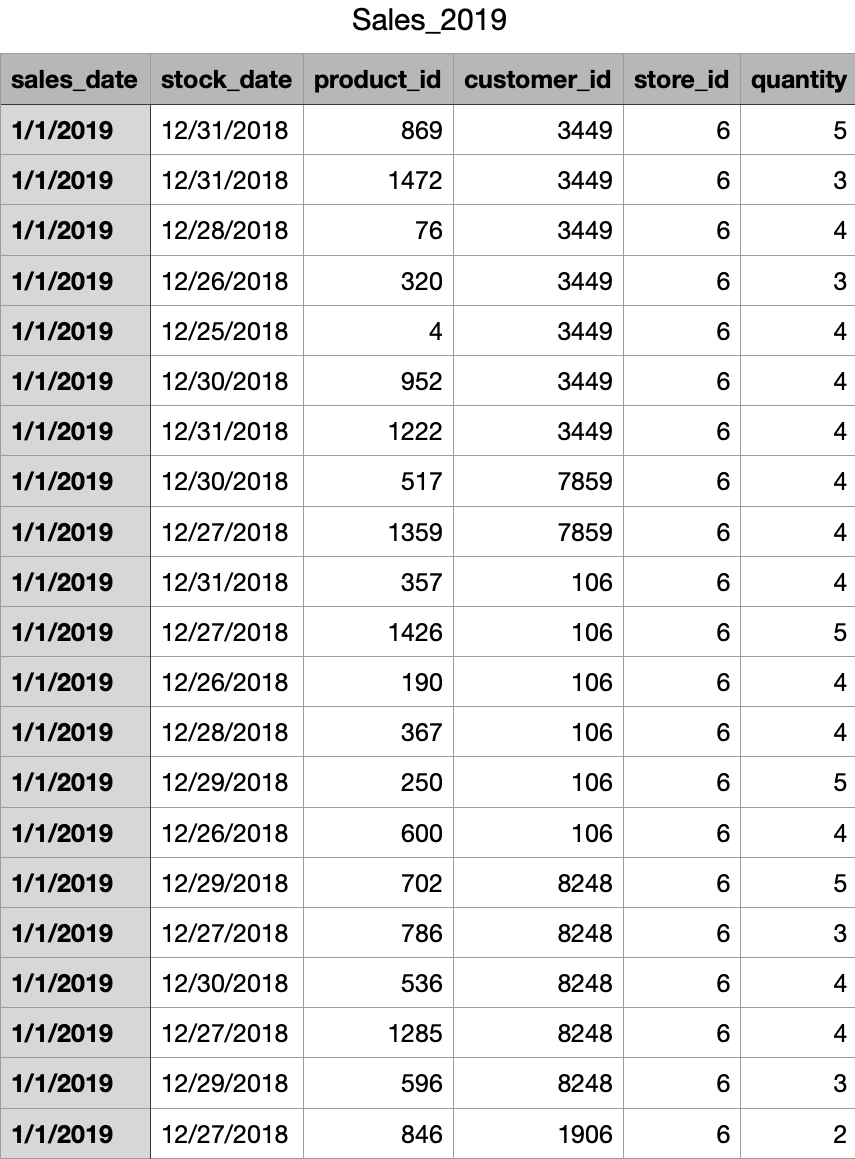
The orginal data was contructed through excel, and later exported into csv files. There a 8 csv files, including 2 for sales in 2019 and 2020. These will be uploaded to the Power Bi Dashboard for modeling.
You can see all the CSV files HERE:
Data model:
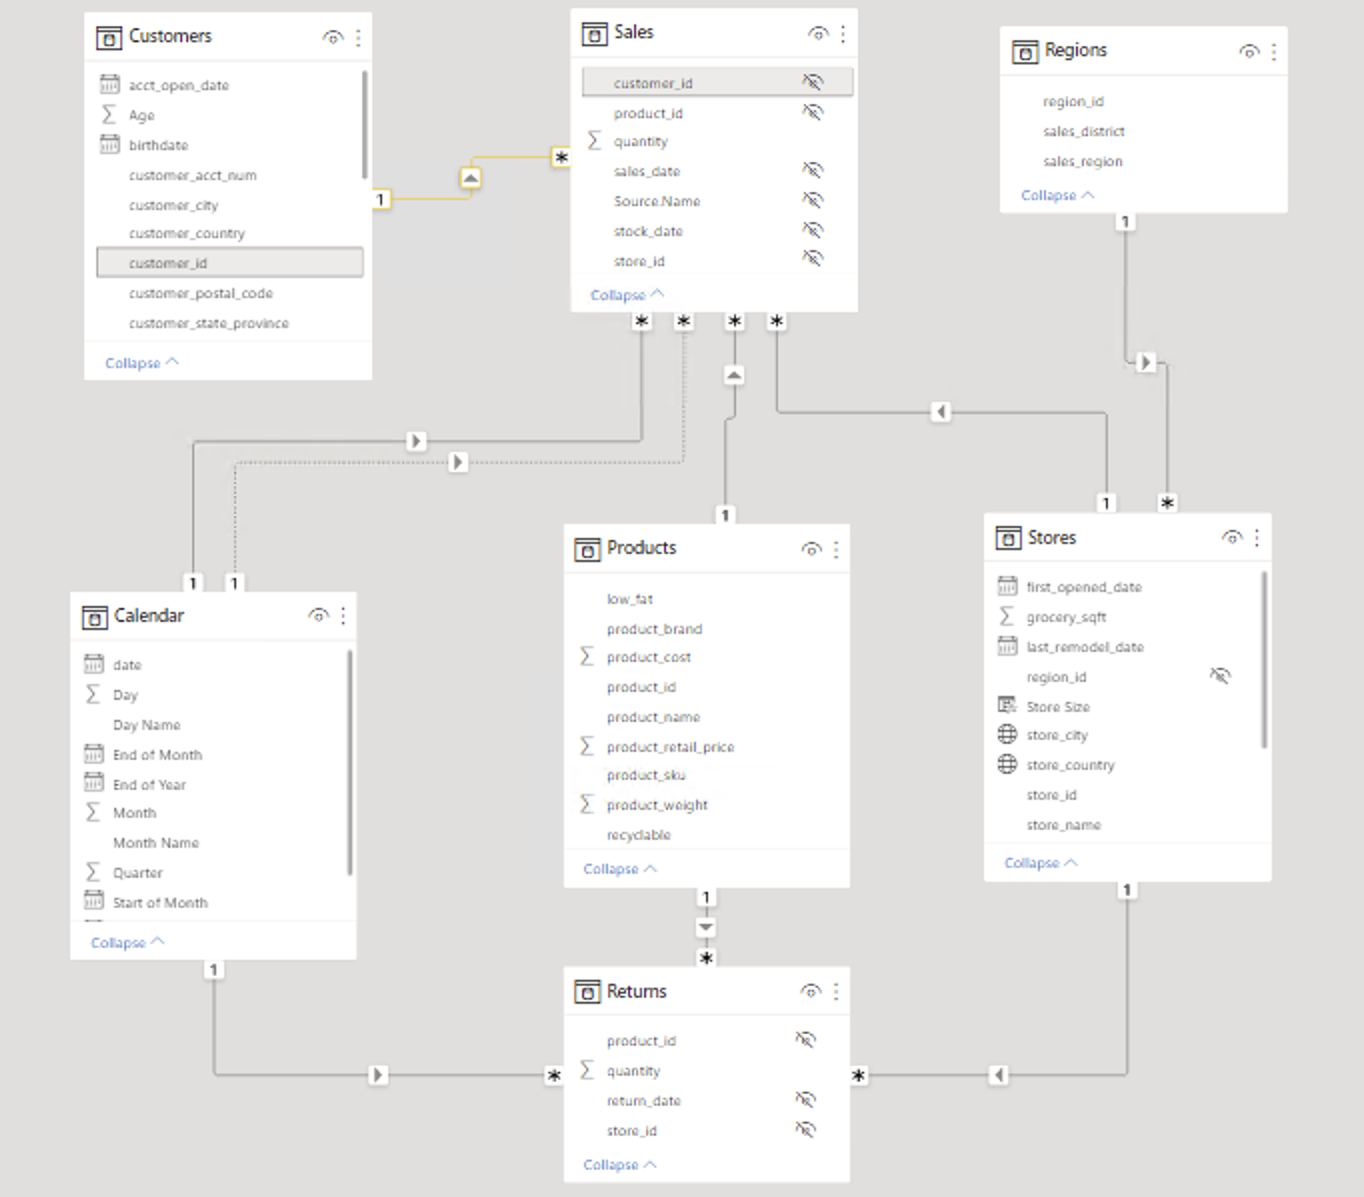
You can see in this image the data model used in Power BI after the data was extracted.

Visualizations
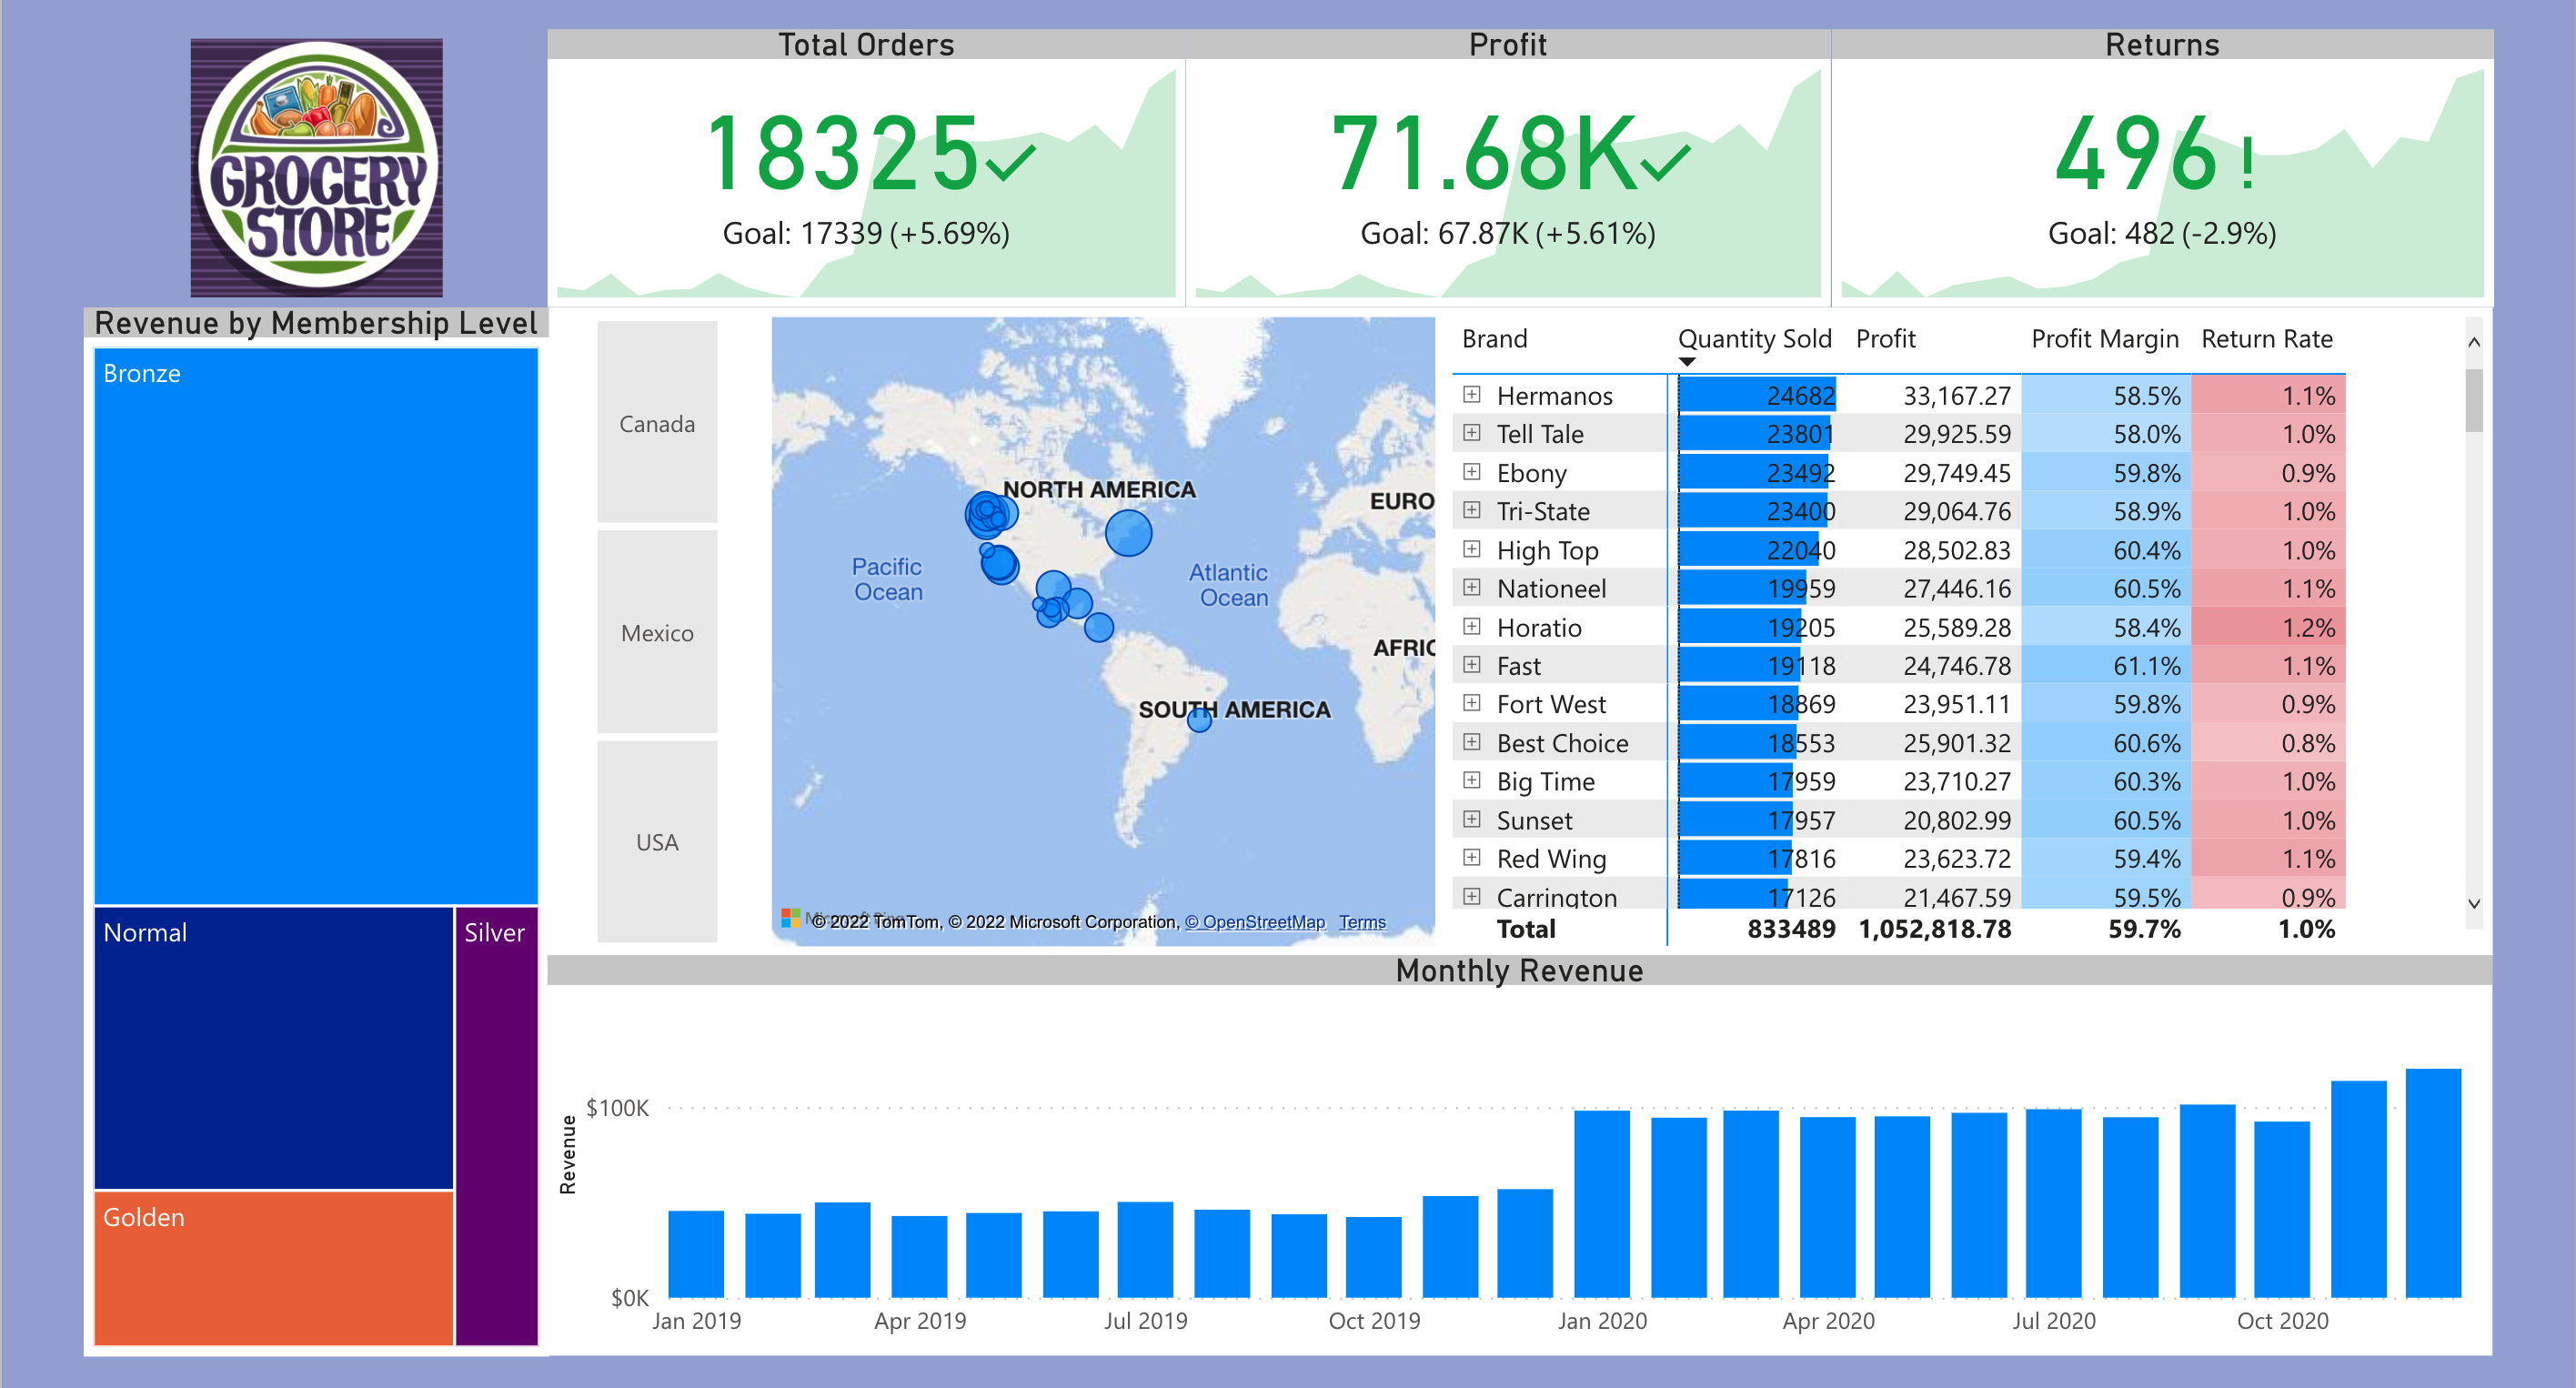
The final product is a 3 pages dashboard. The first is a comapnay snapshot, the second is customer analysis and lastly an overview of sales performance.
You can download the dashboard file HERE or click the image below
Conclusions
- Mexico is the only region that met company goals
- The best customers are Ida Rodriguez, James Horvat, Dawn Laner
- The most profitable product is Landslide Seaseme Oil
- Orders and Profits increased in 2020, as well as the number of returns.

